Reward Factor Analysis
Reward Factor Analysis
Author’s Note
DUOS invited me to join Eric Santa and Martha Osos in writing their December 2022 Insight Briefing in which we showed the importance of the Reward Factor in Medicare Advantage Star Ratings. This blog is a companion “deep dive” into the math that didn’t belong in the briefing format.
Introduction
When people ask me what they’re not tracking closely enough in Stars, I give them a simple rubric:
Is your plan below 4 Stars?
Yes ---> the two 5x Improvement Measures
No ---> the Reward Factor
The first point is that Star Ratings move much faster up towards 4-Stars when they have broad annual improvement instead of larger gains in fewer measures. It’s just how the improvement measures math works out. But scores will eventually plateau, what then? 5 Star improvements becomes impossible. Once you’re in 4-Star territory, the key to getting to 4.5 – and especially from there to 5 Stars – is the Reward Factor.
In the Insight Briefing, we included the following table with an example of two contracts with the same weighted average across 34 measures. Plan 1 had “high variance” and Plan 2 had “low variance” across these measures. But Plan 1 is 4 Stars and Plan 2 is 4.5 Stars.

These are real contracts and their real 2023 star ratings. Plan 2 is not alone. Out of 507 MA plans, 95 were helped up to the next half-star by the Reward Factor. But Plan 1 is also not alone. 19 plans could have been 4.5 Stars if they had a lower variance.
The main finding in this blog is summarized in the graph at the top of the page. It’s a little complicated but once you wrap your mind around what it shows, you’ll recognize just how critical the Reward Factor is in Stars. The rest of this blog will explain the graph, delve into the math and explain the concepts and calculations.
NOTE: In our joint article, Martha reminded us that CMS has announced they’re considering replacing the Reward Factor with a health equity index. (2023 CMS Advance Notice) If and when CMS makes this change, we expect the new index to behave similarly to the Reward Factor. Update: CMS included this in the 12/14/2022 Proposed Rule for 2027 Stars.
Essential 5-Star Math
If you’re deep enough into Stars to have read this far, you already think of Star Ratings as a weighted average of 30-something measures[1] with a couple of adjustments – CAI and Reward Factor - and then rounded on the half-Star. But have you ever thought about the math and how hard it would be to get to 5 without the adjustments?

For a refresher, you can take a look at BHA’s Stars Tutorial on this topic. The half-star rounding is a little different than what they taught in 4th grade, so don’t forget that 5-Stars is 4.750 or higher and 4.5 Stars is 4.250 or higher.
Here’s the math problem. 5-Stars on lots of measures is hard. For one measure, it’s not – about 28% of scores are 5-Stars. With that probability, the random chance of 2 in a row is 8%, 3 in a row is 2% and 7 in a row is 1 in a million. The odds of 34 in a row for a perfect 5.000 are basically zero. Of course, it’s not random. If you’re good at Statin Adherence you’re probably also good at Diabetes Adherence, and probably HEDIS and Appeals to boot. But all caveats aside, the more 5s you need, the harder it is going to get.
To get to 4.750 you need at least 3/4 of the measures to be 5. That’s about 27 measures. The other 9 can be lower but only a little bit. If anything falls below 4, you’ll need more 5s to make up for it. The measures are so diverse and so competitive that to “run the tables” like this is so hard that it’s rare.
What if instead of 4.750, you only had to get to 4.350? That’s a lot easier. You can do it with thirteen 5s and twenty-six 4s. Or get more 5s and mix in some lower scores. Indeed, that’s what happens. What we showed in our analysis is that only 1 plan had a 4.750 weighted average. The other fifty-six 5-Star plans had a raw average between 4.350 and 4.750 but had a reward factor that pushed them up to 5.
I should mention that there is a second adjustment, the Categorical Adjustment Index (CAI) that is also added or subtracted from the raw score. The CAI is calculated from the percentage of members that are disabled or low-income. It’s not something that plans can “achieve”, and thus isn’t something to work on through quality improvement efforts. It also tends to be a smaller adjustment, ranging from -.04 to +.14.
Reward Factor Calculation
The Reward Factor is calculated in 3 steps:
- Set the Mean Average Category. “High Average” is the top 15% of plans by weighted average. (> approx. 4.2) “Relatively High” is the next 20% (> approx. 3.8).
- Set the Variance Category. “Low Variance” is the lowest 30% and “Medium Variance” is the next 40%.
- Assign the reward factor as follows:

Variance
Statisticians use the variance to describe how together close are numbers. For example, if you had three 4s the variance is 0 because they’re all the same number. But we could get the same average of 4 from 3,4, and 5 and we could also get it from 5, 5, and 2 which has a much higher variance.
The tech specs provide this formula:

You’ll need this if you ever want to calculate your own reward factors. In the meantime, just note that the measure weight is part of the calculation and the closer each score is to the average the lower the variance. You would benefit if you could magically shift star “points” from your best measures to your lowest measures.
High and Relatively High Average
The cutoff for “High Average” is 4.2, which is the top 15% of plans, and “Relatively High Average” is 3.8 which is the top 35%. [2] What this means is that the reward factor is simply not possible until a plan hits 3.8 – already in the 4-Star range. The largest reward factor of 0.4 is only for plans above 4.3 and in the “high” scoring.
This brings everything back to the initial point – The reward Factor comes into play when plans are already 4 Stars and makes a huge difference to plans that are already 4.5 Stars. But only if the plan keeps its variance down by minimizing low-scoring results, especially on the highly weighted measures.
Overall Impact on 2023 Stars
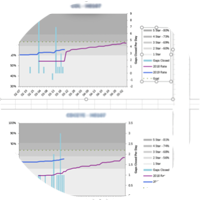
Now let’s return to the graph and I’ll explain how it illustrates exactly how big the reward factor impact is on Stars. Each vertical bar on the graph represents one of the 260 plans that reached at least 4 Stars. The Gray part is the weighted average with the CAI. The blue part is the reward factor. Yellow shows something that didn’t happen – what the reward factor could have been if the plan had a lower variance. The financial benefits for Stars come when the total score rounds to a higher half-Star, so I have also marked lines at the thresholds for each of these.
Below I have circled the points at which the scores crossed the Stars rounding thresholds and marked groups of plans to show the impact of the Reward Factor.

Now you can see the actual impact:
- Only one plan has a gray line above 4.75.
- Group A - Another 56 plans also reached 5 Stars but only when the reward factor was added in.
- Group B – The gray line is above 4.250. These plans are solidly 4.5 Stars with or without the reward factor.
- Group C – The gray line is below 4.250, but once you add in the reward factor, it’s above it. Reward factor pushed these plans to 4.5 Stars.
- Group D – The gray line is below 4.250. If these plans had a lower variance, they would have ended up above 4.5. But alas, they did not and landed at 4 Stars.
- Group E & Group F – These are 4 Stars plans. Even with the reward factor they could not reach 4.5 Stars.
- Group F is those that did not reach 3.8 on the weighted average and so reward factor and variance do not come into play at all.
I simulated the overall distribution of Stars with and without the reward factor. The result is as follows:

This compare with the actual ratings from CMS which are much more favorable:

Further Consideration
I hope this article highlights the importance of minimizing measure variance in your final Star ratings. The main takeaway is that CMS designed Star Ratings to encourage plans to focus on all measures, especially the highly weighted ones such as member experience.
BHA is able to simulate the scoring on overall Star Ratings, Improvement Measure, and on Reward Factor. If you find this article interesting, you may like our Stars Planner (free or premium version), our tutorials, and other content on our website. If you want help digging deeper into your own contracts, please contact us for more information.
You can reach BHA at info@BaltimoreHealthAnalytics.com or go to www.BaltimoreHealthAnalytics.com and register an account to use the tools.
NOTES
[1] - CMS lists 40 measures, but 2 are duplicate between Part D and Part C and counted only once, and 2 are Part C Improvement and Part D Improvement based on other measures. Some measures are also only for Special Needs Plans. In our example, both contracts were better off without Improvement and not SNPs so only 34 measures counted.
[2] - In 2023, CMS calculated 4 different sets of thresholds - with and without the Improvement Measures that can be skipped under the 'Hold Harmless' rules and with and without CBP which was reintroduced during the pandemic. The differences are slight.