Why is everyone sweating about 2023 Stars?
Why is everyone sweating about 2023 Stars?
I received this email last week:
I’ve heard from several health plans with concerns over Stars scores falling off next year. Is there anything explicitly related to the Public Health Emergency that caused Stars scores to increase this year? Or was CMS just more favorable with scoring / cutoffs given COVID concerns.
My quick response was:
Yes, it is related to the PHE – and to CMS being more favorable. Plus, other factors. It's complicated.
It really is complicated. CMS made some rather generous allowances for Stars during covid and these are rolling back. But CMS also has some long planned changes to Stars finally going into effect. Everyone -- really everyone -- is sweating right now trying to discern what all this means for cutpoints and Stars.
There are 4 factors that I'll go through in detail:
- Covid's natural impact on scores and cutpoints
- CMS's adjustments to Stars due to covid
- Cutpoint methodological change to remove "Tukey outliers"
- CMS's jump in the weight of Member Experience
Long Term Trend
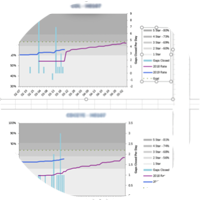
Ever since CMS moved to Minnesota, there's been a Lake Wobegon effect playing out Star Ratings. Consider this chart, directly from the Stars technical specifications:

By definition, 4 Star plans are "above average". In 2011 about a quarter of plans were in 4, 4.5 or 5 Star plans. By 2021 it became about 3/4. Then 2022 happened -- everyone jumped higher. If your plan isn't 4.5 Stars, you're in the minority.
We're about a month away from the public release 2023 Stars results. Plans already have their 2023 scores to review, and in a few days CMS will announce the measure cutpoints and plans will see their actual Star Ratings. What can we expect?
Covid and the PHE
After wildfires in California and an earthquake in Puerto Rico, CMS promulgated rules to protect plans from getting unfairly slammed in Stars from natural disasters. The Tech Notes explain this in detail, but the basic idea is that if 25% of members are in a FEMA designated disaster area, CMS lets plans use their prior year score instead of the disaster impacted score. But what happens in a pandemic when everyone is in a disaster area?
Timeline
- 2020 Stars were based on 2019 data collection applied to 2018 dates of service. All pre-pandemic, no problem.
- 2021 Stars apply to 2019 dates of service. That should be pre-pandemic, but Stay-at-Home orders issued in the spring of 2020 in the middle of HEDIS chart collection. Medicare plans did not even submit hybrid rates.
- 2022 Stars apply 2020 dates of service. That's the peak of the pandemic. The vaccine came out at the end of the year.
- 2023 Stars apply to 2021 dates of service with data collection in 2022 (this year). It's not quite "post pandemic" but it's approaching normalcy. Data collection and measurement this spring was normal. But 2021 was not normal. Vaccinations were only just getting started in January and Delta variant landed in the Fall. Different people reacted differently, and many people skipped some regular preventive health during the year. We're about to find out what that means for Stars.
CMS Adjustments to Scores and Stars
The disaster policy is that plans get the the prior year's score on certain measures (HEDIS and CAHPS). It's a "better of " rule in case the plan somehow scored better during the emergency. So for a couple years now, scores haven't reflected performance on the year measured. That protection is coming off. But what can we expect for results that reflect 2021 dates of service? We know a little bit. CAHPS surveys results came out a month ago (to the plans) and the rumble is that scores on the whole didn't improve. That's a surprise -- due to the member experience change (see the final section), plans have been investing heavily in this area.
I don't know what that portends to HEDIS results, except that as the timeline shows, 2023 Stars are the first to broadly reflect Covid HEDIS. Most of HEDIS is measuring preventive services; these aren't going to snap right back to pre-covid levels. What I think will happen is that it will mirror the restaurant business. Plans centered in regions that reopened faster will be more normal, and plans centered in more cautious regions will fare worse than pre-covid. \We'll see. This is, of course, muddled by the fact that some plans (for example one that we're working with) have simply gotten better at HEDIS execution, and should be getting closer to plans that were quicker to adopt technology and strategy that support higher scores.
Improvement Measure Hold Harmless
Here's a nice gift from CMS. There are two 5x weighted measures - "Part C Improvement" and "Part D Improvement" that can significantly accelerate a plan's Stars movement higher if their scores are moving higher. But it can also drag you lower if your scores are declining. CMS basically took away "part b" of that in 2022. Everyone's Stars were calculated with and without Improvement and plans got whichever is better. The draft tech notes are silent on this, but I think it's it will revert to normal.
Covid and Cutpoints
There are two things happening at once around cutpoints. Both are very technical and have to do with how low scoring plans drive cutpoints lower -- and thus make it easier for everyone else to clear them. One is covid-related and the other is not.
Here's an analogy to set the stage. Imagine a hurdles event at a high school track meet. Assume everything is fair and the best jumpers win. Because this is a bad analogy, suppose further that instead of podiums we give everyone a medal -- the clearly fasted group get gold, the clearly slowest group get bronze and everyone in the middle a silver. What happens if we open the event to middle schoolers too? You kind of have to lower the standards. (or lower the hurdles) Most of the middle schoolers will be in the bottom group. Most of the others will have improved in the sense that they've now beaten somebody. Many of the borderline runners will get a free ride into the higher group. Don't get distracted by my bad analogy but note that the same thing happens in Stars. Letter grades are a better analogy but I liked the idea of working hurdles into this article.
The covid related technical change is as follows. Normally, CMS excludes disaster impacted plans (defined as most members in a disaster area) from Stars when calculating cutpoints. They removed that rule in 2022. It's back (except for 3 measures) in 2023. So fewer "bad scores" driving cutpoints lower means that cutpoints will be higher. How much higher? I don't know. Even before the rule change, we'd expect to see some regression to normal as covid impacts dissipate.
Cutpoint Issue #2 - Tukey Outliers
The outlier issue is a longstanding problem. If you or I were to split plans into 1,2,3,4 or 5 Stars on a measure, we'd probably do something like this: (a) assume bell curve, (b) give bottom and top 10% a rating of 1 and 5 stars, and (c) put the middle 40% 3 Stars (average) and the rest 2 and 4. A nice easy calculation. But CMS is way more academic and theoretical than that. I think they're impacted by being so close to Johns Hopkins. (Sorry for my style - I'm close to Hopkins too) Instead they use a clustering algorithm that groups "like scores" so that there is more of a difference between the groups. This is theoretically great except that it has a problem I just outlined: outliers make cutpoints artificially easier. I wrote about this years ago; check out my 2018 blog:

The key point is summarized in a picture:

One lonely plan in 2016 became its own 1-Star group, so 2-Stars got easier and 3- and so on up the line. In 2017 the tail came in, cutpoints jumped higher.
CMS is finally addressing this. They are putting in "Guardrails" that kick outliers out of the calculation. It's based John Tukey's idea of calling outliers anything more than 1.5x the range between the quartiles. You don't need to know that. What you need to know is that that one 23% plan would have been ignored and cutpoints would have been harder in 2016.
There's a recent fun article from Ana and Melissa on RISE's website that discuss this further, and question whether this was happening or not. The consensus is that, yes, this is happening and yes, the impact will be huge. Icario has an article on this, and Rex did a podcast too. My gloat is just that I picked up on years earlier.
Member Experience
Last, and certainly not least, is the annual movement of measures in and out of Stars and changes in the weights. This happens every year, but this year is a doozy.
There are a few small changes (Statins, blood pressure) plus a continuation of last year's temporary removal of physical and mental health. But the big difference is that the "Patient Experience/Complaints" measures are jumping to 4x weight. The used to be 1.5 but CMS made a policy decision a few years back to focus energy on it. CAHPS used to be a relatively minor part of Stars; now it's the most important piece.
This is a real challenge for plans. If you go to BHA's website you can see why. Some plans have long since mastered HEDIS with provider incentives, better chart review tech, etc. and medication adherence (e.g. free drugs). But surveys are hard. You can't say "This person doesn't like our plan, we'd better close that gap." Instead you have to figure out how to measure member sentiment in real time, identify the underlying factors, and figure out how to remediate them. Even then, you don't know who will be surveyed. It's a much more interesting challenge than finding the members without cancer screens and encouraging them to get tested.
The 2022 Stars data is posted on BHA's website. Select Tools->Stars Explorer->Measures and look at C17-C23 compared to other measures. There is much more diversity, and you'll notice that some of the plans that are really struggling are big plans that have long since become quite good at other measures. Remember, the Stars leaders already know their Stars for CAHPS measures (they are on the report card that plans get before Plan Preview 1) and they're not looking great.

Summary
This is a quick, not super researched article. Please comment if I overlooked something or it's not clear. Or drop me a line if you and we can chat about it further. It's going to be an interesting month.