Cutpoint Percentiles by Measure
Cutpoint Percentiles by Measure
We know that CMS “grades on a curve” each year to decide cutpoints for each measure following a complex “clustering” method described in the tech specs. We were curious what this means in practice. If you achieved 5 stars, does that mean you typically beat 90% or 50% of other plans? Is there a pattern to relative performance and the cutpoints? The answer: it depends.
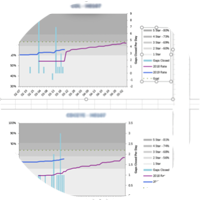
To analyze this, we decided to standardize the measures by converting individual contract scores into percentiles. The CMS cutpoints for each measure were then referenced, matched to the corresponding percentile for each measure, and graphed. In addition, averages of the four lines were taken for ease of comparison. And since percentiles were calculated, we are free to directly compare each measure.
The main takeaway from this graph is the variability of where cutpoints fall within each measure. We would expect each cutpoint to fall at the same percentile for every measure, but this is not the case. For example, the four star cutpoint has an average value of the 43rd percentile but many outliers exist such as C34 having a cutpoint at the 6th percentile and C18 at the 82nd.
These differences in cutpoint percentiles lend themselves to CMS’s clustering method. While there are some outliers, such as the two listed above, the average cutpoint percentile calculated is a decent gauge for about half of the measures (center of the graph). The average percentiles for the 2,3,4, and 5 star cutpoints were found to be at the 6th, 21st, 43rd, and 71st respectively.
In our next post, we will take a dive into the three future measures: Statin Therapy for Patients with Cardiovascular Disease, Statin Use in Persons with Diabetes, and Hospitalization for Potentially Preventable Complications.