HEDIS Goals
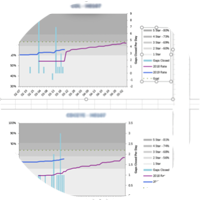
Every plan makes some assumptions about cutpoints to HEDIS targets. The problem is, cutpoints change. You may hit your targets and still miss your Stars goals.
There’s a second set of targets that you should also manage to during HEDIS. These are the ones that will determine your rating on the Part C Improvement Measure.
This Tutorial
This tutorial describes one way to get and use those targets. You can build the formulas using the Tech Specs. But there’s an easier way. CMS provides an Excel spreadsheet with formulas already embedded that shows your hcontract’s Improvement calculation for the current year compared to the prior year. Here we describe step-by-step how to modify CMS’s spreadsheet to predict the # of HEDIS hybrid compliant charts needed to reach SSIL and SSDL.
The step-by-step does not require advanced Excel experience. IF you have that, you likely can just skim it and get the idea. The formatting instructions are not necessary but we find it helpful.
Definitions
Part C Improvement – One of the two highest weighed (5x) Star Measures. (The other being the Part D analog). There is no direct measurement; instead it’s a calculation of other measures’ results.
SSIL – Statistically Significant Improvement Level – the exact rate (and # of compliant hits) needed to be considered “Improved.”
SSDL - Statistically Significant Decline Level – the exact rate needed to not be considered “declined”
Using the Targets
You want all of your rates to be “Improved”. If you can’t get there, at least be sure to get the consolation prize of avoiding “Declined” in all plans and measures. Whatever tracking report you use during HEDIS should include these targets. (If you don’t have one, BHA has a great one you can license.)
Quick Refresher on the Improvement Calculation
Formula idea:
- Count how many measure scores improved.
- Minus how many measure scores declined.
- Divide buy the # of measures that could have gone up or down.
Two caveats:
- Improvement or decline must be “Statistically Significant” to count (like a JAMA paper.
- The addition and subtraction is weighted.
Getting to Stars
- The resulting ratio is then your Plan’s raw score for the measure.
- A score of zero is “3 Stars” then cutpoints are applied like other measures.
Notice that we said nothing about cutpoints or measure Stars until the last step. Improvement/Decline/No Change is determined from measure scores and is not dependent on the cutpoints or Star rating.* There’s a very important implication of this – you can calculate exactly what value you need to achieve without worrying about cutpoint changes.
This is really useful during HEDIS season. You can know exactly how many numerator hits it takes to be “Improved”. If every other measure stays flat year-over-year that will usually get you to 4 Stars by itself.
Steps
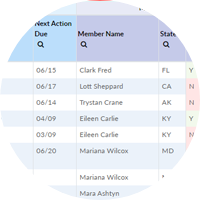
- Email CMS Part C and D support and request that they send you the spreadsheet for your hcontract(s).
- Open Excel. Make a copy of the worksheet Part_C for backup.
- Add conditional formatting to column “T” – Improvement/Decline or No Change.
- Highlight column T
- Go “Conditional Formatting” -> “Highlight Cell Rules” -> “Equal To”
- In the box type “Significant Decline” and select “Light Red Fill with Dark Red Text”, click OK.
- Do the same for “Significant Improvement” and set the format color to “Dark Green with Dark Green Fill”
- You will see a mix of normal, green and red cells depending on last year’s performance.
- Highlight column T
- Now we have to dummy update the data so that it’s comparing the current year (2023) with next contract year (2024).
- Locate CY 2022 Measure Score data in column E and CY 2023 Measure Score in column F.
- Highlight the current year values in column F4 to F 29 (as of 2023)
- Right click -> Copy
- Click on column E4
- Right Click -> Paste Special
- Select “Values” to copy the current (2023) Stars values over top the 2022 Stars Values
- Click OK. Column G, the Difference column will go to zero, and column where we just setup conditional formatting will change entirely to “No Significant Change” or “Not Applicable”
- Locate the Year1 and Year2 fields in cells B35 and B36.
- Change them to 2023 and 2024 so that it correctly labels the comparison we want.
- Locate CY 2022 Measure Score data in column E and CY 2023 Measure Score in column F.
- Repeat the same to copy the denominator column values from column M to column K.
- Create a space for storing the SSIL and SSDL fields that you will be “finding”
- Highlight column N
- Insert two columns.
- Label these SSDL (not decline) and SSIL
- Highlight cells N5-05 for Colorectal Cancer, and format Brown background
- Repeat for the other hybrid measures C09 (CDC-EYE), C11 (CDC-A1C) and C15 (MRP).
- DO the same for C06, C07, (COAs) – if this is a SNP plan
- Highlight column N
- Create formulas for CY 2024 rate based on the numerator and denominator
- Click on Cell F5 – the CY2024 (now) Measure Score.
- Set the formula to =L5/M5 * 100 (don’t forget the x100)
- This will set the rate to zero and the conditional formatted column (now V) to be Significant Decline.
- Change the color of cell L5 to Orange
- Repeat for the other hybrid measures.
- Now everything is set to go.
- Click on Cell F5 – the CY2024 (now) Measure Score.
- Check the denominators of each measure.
- Typically, it’s 411 year after year. But verify it before
- Typically, it’s 411 year after year. But verify it before
- Now we apply the highly sophisticated “Guess and Check” process to find SSDL
- For each of the orange cells, we want the minimum numerator value that changes “Significant Decline” to “No Significant Change” and put that in column “N”. That's your target.
- You could start 1, then try 2, then keep going until it changes.
- But the faster thing to do is keep cutting the interval in half until you’re close and then cycle through a few values to find the transition point. It takes about a minute.
- In column N, record for SSDL the minimum value for “No Significant Change”.
- Repeat for the other measures.
- For each of the orange cells, we want the minimum numerator value that changes “Significant Decline” to “No Significant Change” and put that in column “N”. That's your target.
- Now find SSIL
- Same process, just looking for the transition to “Significant Improvement.”
- Repeat for all hybrid measures.
- Same process, just looking for the transition to “Significant Improvement.”
- That’s it. Use these values alongside your Stars targets for HEDIS.
This whole thing can be done by writing a program. But once you know how to do it, you're gongto spend 5 mins/conrtact per year and may not be worth the trouble.
Footnotes and Last Caveats
- Strictly speaking, you need the “correlation factor” that is published each year to get the correct calculation. We have never seen a case where this made a material difference.
- “Hold Harmless” rules protect the plan from being dinged by a Decline if the measure is 5 stars both years.
- Measures newly added to Part C Improvement will not be in the spreadsheet. You need the correlation factor which CMS won't publish until the Tech Specs come out.
Shortcut
If close is good enough, most of the time the confidence interval is about -2% to +2% around last year's HEDIS values. This varies with the denominator, for example if you have 50,000 members in a measure instead of 411 it will be closer to like 1/4%.
Copyright
This tutorial is copyright 2021 Baltimore Health Analytics LLC. It may not be reproduced in whole or in part without prior authorization.


