Yearly Data Update:
- Star Data: 2026 Star Annual data has been updated.
- Display Measure Summary : 2025 Annual data has been updated.
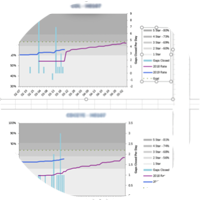
| Title | Report Period | Updated Date |
| Display Measure | 2025 |
05/12/2025 |
| Star Data | 2026 |
10/10/2025 |
| Display Measure | 2026 |
01/30/2026 |